Tested using Chrome 94.0.4606.54 (runtime settings).
| Metric | Value |
|---|---|
| Performance Score | 54 |
| Total Page Transfer Size | 5.4 MB |
| Requests | 78 |
| TTFB [median] | 192 ms |
| Fully Loaded [median] | 9.823 s |
| First Visual Change [median] | 1.277 s |
| First Contentful Paint (FCP) [median] | 1.006 s |
| Largest Contentful Paint (LCP) [median] | 1.991 s |
| Cumulative Layout Shift (CLS) [median] | 0.21 |
| Total Blocking Time [median] | 273 ms |
| Max Potential FID [median] | 167 ms |
| CPU long tasks [median] | 10 |
| CPU longest task duration | 167 ms |
| Speed Index [median] | 1.915 s |
| Visual Complete 85% [median] | 2.319 s |
| Visual Complete 99% [median] | 2.353 s |
| Last Visual Change [median] | 2.353 s |

| Metric | min | median | mean | max |
|---|---|---|---|---|
| Visual Metrics | ||||
| FirstVisualChange | 1.277 s | 1.277 s | 1.277 s | 1.277 s |
| LastVisualChange | 2.353 s | 2.353 s | 2.353 s | 2.353 s |
| SpeedIndex | 1.915 s | 1.915 s | 1.915 s | 1.915 s |
| LargestImage | 2.319 s | 2.319 s | 2.319 s | 2.319 s |
| LastMeaningfulPaint | 2.319 s | 2.319 s | 2.319 s | 2.319 s |
| VisualReadiness | 1.076 s | 1.076 s | 1.076 s | 1.076 s |
| VisualComplete85 | 2.319 s | 2.319 s | 2.319 s | 2.319 s |
| VisualComplete95 | 2.353 s | 2.353 s | 2.353 s | 2.353 s |
| VisualComplete99 | 2.353 s | 2.353 s | 2.353 s | 2.353 s |
| RUM Metrics | ||||
| TTFB | 192 ms | 192 ms | 192 ms | 192 ms |
| LCP | 1.991 s | 1.991 s | 1.991 s | 1.991 s |
| FCP | 1.006 s | 1.006 s | 1.006 s | 1.006 s |
| firstPaint | 1.006 s | 1.006 s | 1.006 s | 1.006 s |
| loadEventEnd | 2.811 s | 2.811 s | 2.811 s | 2.811 s |
| CLS | 0.2086 | 0.2086 | 0.2086 | 0.2086 |
| CPU | ||||
| Total Blocking Time | 273 ms | 273 ms | 273 ms | 273 ms |
| Max Potential FID | 167 ms | 167 ms | 167 ms | 167 ms |
| CPU long tasks | 10 | 10 | 10 | 10 |
Run 1 SpeedIndex median
Choose HAR:
Use--filmstrip.showAll to show all filmstrips.
 0 s0.6 sCPU Long Task duration 123 ms0.9 sCPU Long Task duration 53 msCPU Long Task duration 104 ms1.1 sFirst Contentful Paint 1.006 sLayout Shift 0.00527 1.037 sCPU Long Task duration 69 ms1.2 sCPU Long Task duration 75 msLayout Shift 0.00167 1.182 s
 1.3 sDOM Content Loaded Time 1.265 sFirst Visual Change 1.277 sLayout Shift 0.01600 1.300 s1.4 sCPU Long Task duration 103 ms
 1.5 sCPU Long Task duration 77 ms
 1.6 sLayout Shift 0.18564 1.568 s
 1.7 sCPU Long Task duration 69 ms
 1.8 sLayout Shift 0.00001 1.706 sCPU Long Task duration 167 ms
 1.9 s
1.9 s 2.4 sVisual Complete 85% 2.319 sLargest Image 2.319 sLast Visual Change 2.353 sVisual Complete 95% 2.353 sVisual Complete 99% 2.353 s
The coach helps you find performance problems on your web page using web performance best practice rules. And gives you advice on privacy and best practices.

| Title | Advice | Score |
|---|---|---|
| Use a good Content-Security-Policy header to make sure you you avoid Cross Site Scripting (XSS) attacks. (contentSecurityPolicyHeader) | Set a Content-Security-Policy header to make sure you are not open for Cross Site Scripting (XSS) attacks. You can start with setting a Content-Security-Policy-Report-Only header, that will only report the violation, not stop the download. | 0 |
| Description: Content Security Policy is delivered via a HTTP response header, and defines approved sources of content that the browser may load. It can be an effective countermeasure to Cross Site Scripting (XSS) attacks and is also widely supported and usually easily deployed. https://scotthelme.co.uk/content-security-policy-an-introduction/. | ||
| Offenders: | ||
| Set a permission policy header that opt out your users being tracked in Chrome by FLoC. (disableFLoCHeader) | Set a permission policy header that opt out Chrome for tracking what your users do on your site. | 0 |
| Description: Googles new tracking method is called Federated Learning of Cohorts (FLoC) and it groups you based on your interests and demographics, derived from your browsing history, to enable creepy advertising and other content targeting without third-party cookies. You can avoid that by setting a Permissions-Policy header with the value of interest-cohort=(). See https://www.eff.org/deeplinks/2021/03/googles-floc-terrible-idea. | ||
| Offenders: | ||
| Avoid using Google reCAPTCHA (googleReCaptcha) | You share your user data with Google since you use Google reCAPTCHA. | 0 |
| Description: You should avoid using Google reCAPTCHA since it will share your users information with Google. | ||
| Offenders: | ||
| Set a referrer-policy header to make sure you do not leak user information. (referrerPolicyHeader) | Set a referrer-policy header to make sure you do not leak user information. | 0 |
| Description: Referrer Policy is a new header that allows a site to control how much information the browser includes with navigations away from a document and should be set by all sites. https://scotthelme.co.uk/a-new-security-header-referrer-policy/. | ||
| Offenders: | ||
| Set a strict transport header to make sure the user always use HTTPS. (strictTransportSecurityHeader) | A strict transport header is set but miss out on setting includeSubDomainsThe max age is lower than six months. Increase it to get a better score. | 70 |
| Description: The HTTP Strict-Transport-Security response header (often abbreviated as HSTS) lets a web site tell browsers that it should only be accessed using HTTPS, instead of using HTTP. https://developer.mozilla.org/en-US/docs/Web/HTTP/Headers/Strict-Transport-Security. | ||
| Do not share user data with third parties. (thirdPartyPrivacy) | The page has 3% requests that are 3rd party (2 requests with a size of 354.9 kB). The page also have request to companies that harvest data from users and do not respect users privacy (see https://en.wikipedia.org/wiki/Surveillance_capitalism). The page do 1 utility request and uses 1 utility tool. The page do 2 survelliance requests and uses 2 survelliance tools. | 0 |
| Description: Using third party requests shares user information with that third party. Please avoid that! The project https://github.com/patrickhulce/third-party-web is used to categorize first/third party requests. | ||
| Offenders: | ||
| Page info | |
|---|---|
| Title | AEC Daily - Free Continuing Education |
| Width | 1350 |
| Height | 2631 |
| DOM elements | 806 |
| Avg DOM depth | 10 |
| Max DOM depth | 13 |
| Iframes | 0 |
| Script tags | 30 |
| Local storage | 0 b |
| Session storage | 0 b |
| HTML vs AMP | Plain good HTML page |
| Resource Hints |
|---|
| preconnect |
| https://fonts.bunny.net/ |
| https://static.aecdaily.com/ |
Data collected using Wappalyzer. Use --browsertime.firefox.includeResponseBodies htmlor --browsertime.chrome.includeResponseBodies htmlto help Wappalyser find more information about technologies used.
| Technology | Confidence | Category |
|---|---|---|
| PHP 8.1.29 | 100 | Programming languages |
| Apache | 100 | Web servers |
| reCAPTCHA | 100 | Security |
| jQuery | 100 | JavaScript libraries |
| OWL Carousel | 100 | Widgets |
| FancyBox | 100 | JavaScript libraries |
Data collected using Third Party Web.
| Utility |
|---|
| Other Google APIs/SDKs |
| Survelliance |
| Other Google APIs/SDKs |
| Google CDN |
| Cdn |
| Google CDN |
| Visual Metrics | |
|---|---|
| First Visual Change | 1.277 s |
| Speed Index | 1.915 s |
| Largest Image | 2.319 s |
| Last Meaningful Paint | 2.319 s |
| Visual Complete 85% | 2.319 s |
| Visual Complete 95% | 2.353 s |
| Visual Complete 99% | 2.353 s |
| Last Visual Change | 2.353 s |
| Visual Readiness | 1.076 s |
| Navigation Timing | |
|---|---|
| backEndTime | 192 ms |
| domContentLoadedTime | 1.265 s |
| domInteractiveTime | 1.265 s |
| domainLookupTime | 3 ms |
| frontEndTime | 2.573 s |
| pageDownloadTime | 42 ms |
| pageLoadTime | 2.807 s |
| redirectionTime | 0 ms |
| serverConnectionTime | 42 ms |
| serverResponseTime | 165 ms |
| Google Web Vitals | |
|---|---|
| First Contentful Paint (FCP) | 1.006 s |
| Largest Contentful Paint (LCP) | 1.991 s |
| Cumulative Layout Shift (CLS) | 0.21 |
| Total Blocking Time (TBT) | 273 ms |
| Extra timings | |
|---|---|
| First Contentful Paint (FCP) | 1.006 s |
| First Paint | 1.006 s |
| Largest Contentful Paint (LCP) | 1.991 s |
| Load Event End | 2.811 s |
| Fully loaded | 9.823 s |
When in time the page main content is rendered (collected using the Largest Contentful Paint API). Read more about Largest Contentful Paint.
| Element type | IMG |
| Element/tag | <img data-src="https://sizer.aecdaily.com/0x380/res/marketing_images/1046562/hydaway01.png" alt="Hydraulic Door Applications" title="Hydraulic Door Applications" class="owl-lazy" src="https://sizer.aecdaily.com/0x380/res/marketing_images/1046562/hydaway01.png" style="opacity: 1;"> |
| Render time | 1.991 s |
| Load time | 1.991 s |
| URL | https://sizer.aecdai...562/hydaway01.png |
| Size (width*height) | 315062 |
| DOM path | |
| div:eq(1) > div#left-container > div:eq(0) > div > div:eq(0) > div > div:eq(5) > div > img> div:eq(1) > div#left-container > div:eq(0) > div > div:eq(0) > div > div:eq(5) > div > img> | |

The largest contentful paint is highlighted in the image. If no element is highlighted the element was removed before the screenshot or the LCP API couldn't find the element.
The Largest Contentful Paint API highlighted this image as a part of the LCP.

0.20860 cumulative layout shift collected from the Cumulative Layout Shift API.
These HTML elements contribute most to the Cumulative Layout Shifts of the page. The higher score, the more layout shift.
| Score | HTML Element |
|---|---|
| 0.18564 | <div id="" class="column12 omega"></div>,<div class="image-frame" style="padding-top: 45.82%; height: unset;"></div>,<div class="image-frame" style="padding-top: 45.82%; height: unset;"></div>,<div class="image-frame" style="padding-top: 45.82%; height: unset;"></div>,<div class="image-frame" style="padding-top: 45.82%; height: unset;"></div> |
| body > div:eq(1) > div#left-container > div:eq(1),body > div:eq(1) > div#left-container > div:eq(1) > div > div > div:eq(4) > a > div > div,body > div:eq(1) > div#left-container > div:eq(1) > div > div > div:eq(5) > a > div > div,body > div:eq(1) > div#left-container > div:eq(1) > div > div > div:eq(6) > a > div > div,body > div:eq(1) > div#left-container > div:eq(1) > div > div > div:eq(7) > a > div > div | |
| 0.01600 | <div class="visual buttons center"></div>,<div class="visual buttons center"></div>,<p class="description-featured"></p>,<div class="visual buttons center"></div>,<div class="visual buttons center"></div> |
| body > div:eq(1) > div#left-container > div:eq(1) > div > div > div:eq(2) > div,body > div:eq(1) > div#left-container > div:eq(1) > div > div > div:eq(0) > div,body > div:eq(1) > div#left-container > div:eq(1) > div > div > div:eq(2) > a > div > p:eq(2),body > div:eq(1) > div#left-container > div:eq(1) > div > div > div:eq(3) > div,body > div:eq(1) > div#left-container > div:eq(1) > div > div > div:eq(1) > div | |
| 0.00527 | <p id="tagline"></p>,<div id="top-nav-container" class="container12"></div> |
| body > div#full-header-container > div#full-header-container-inner > div#header > div#logo-container > p#tagline,body > div#full-header-container > div#top-nav-container | |
| 0.00167 | <div id="full-header-container-inner" class="container12"></div>,<div id="top-nav-container" class="container12"></div> |
| body > div#full-header-container > div#full-header-container-inner,body > div#full-header-container > div#top-nav-container | |
| 0.00001 | <button type="submit" class="top-nav-search-button" id=""></button> |
| body > div#full-header-container > div#full-header-container-inner > div#header > div:eq(1) > div > form#search-aec-topnav > button | |
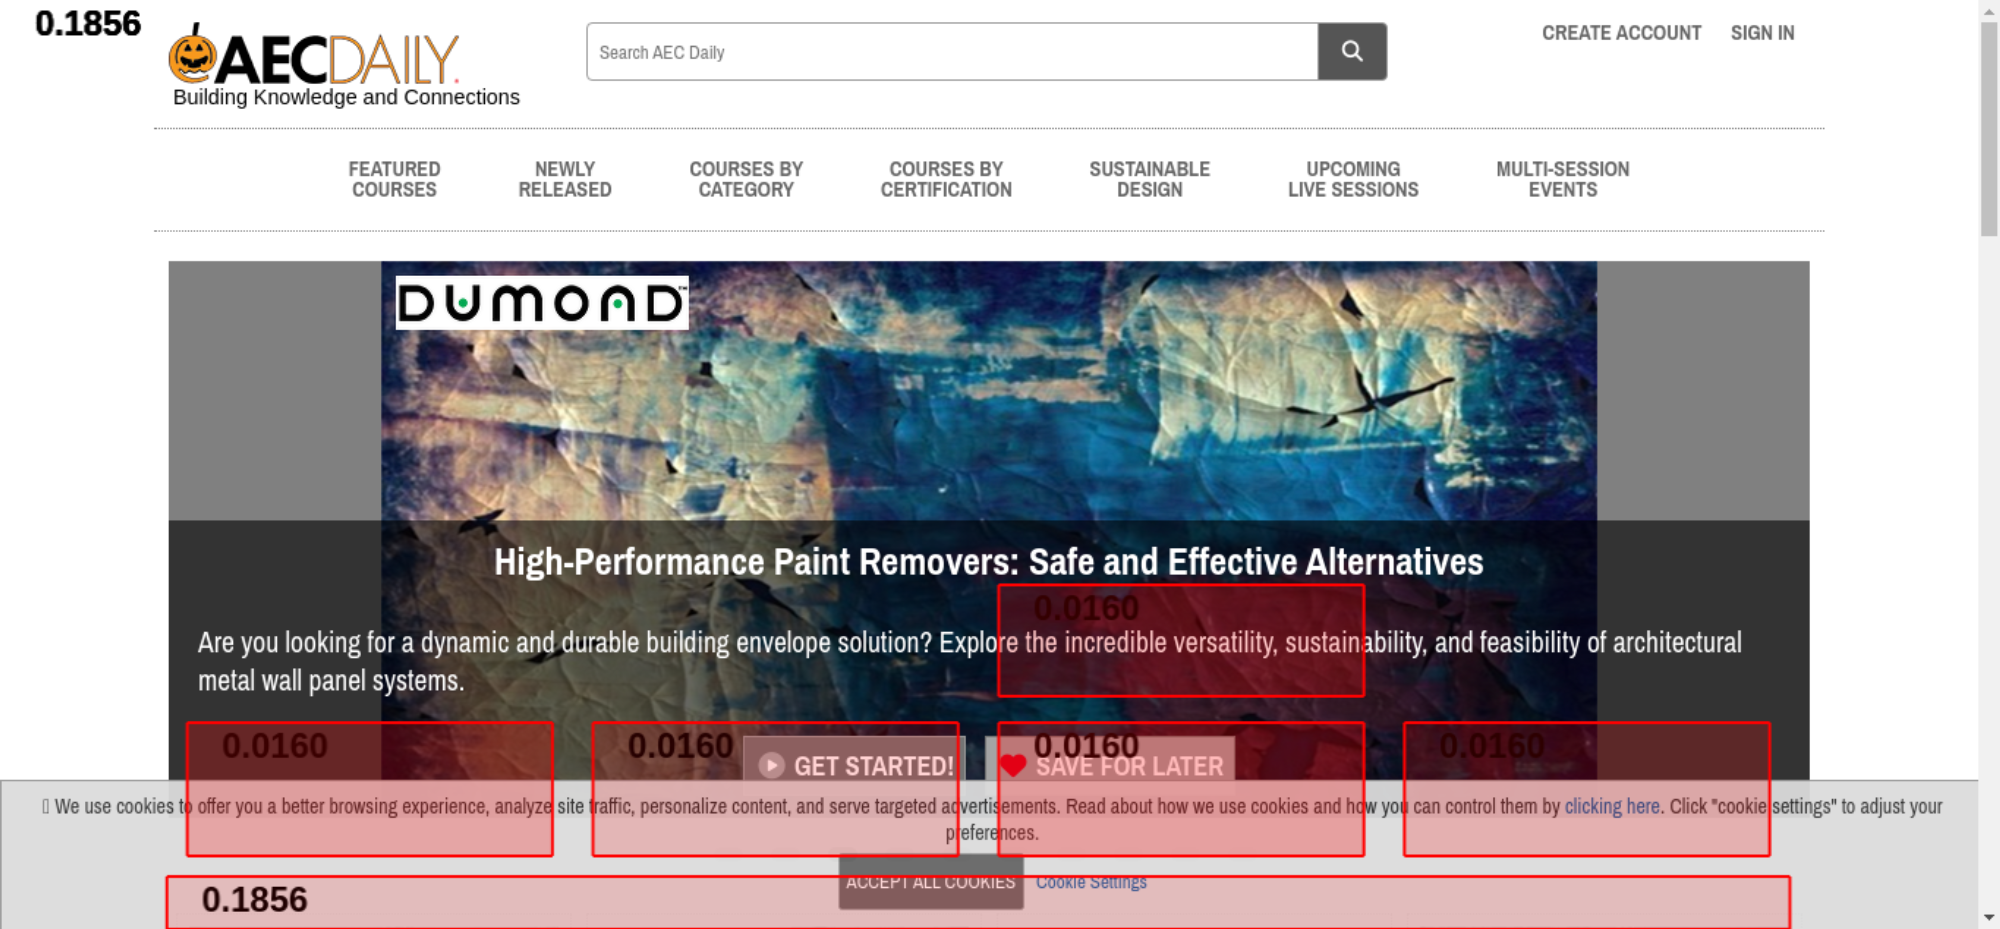
The elements that have shifted place is highlighted in the image (that have a higher value than 0.01). If the element shifted outside of the viewport, you will not see it there. It can be hard to understand what content that has shifted, if that's the case, checkout the video or the filmstrip of the run.
There are no Server Timings.
There are no custom configured scripts.
There are no custom extra metrics from scripting.
| name | value |
|---|---|
| AudioHandlers | 0 |
| Documents | 1 |
| Frames | 1 |
| JSEventListeners | 101 |
| LayoutObjects | 1580 |
| MediaKeySessions | 0 |
| MediaKeys | 0 |
| Nodes | 2094 |
| Resources | 79 |
| ContextLifecycleStateObservers | 3 |
| V8PerContextDatas | 1 |
| WorkerGlobalScopes | 0 |
| UACSSResources | 0 |
| RTCPeerConnections | 0 |
| ResourceFetchers | 1 |
| AdSubframes | 0 |
| DetachedScriptStates | 0 |
| ArrayBufferContents | 0 |
| LayoutCount | 28 |
| RecalcStyleCount | 55 |
| LayoutDuration | 221 |
| RecalcStyleDuration | 109 |
| DevToolsCommandDuration | 77 |
| ScriptDuration | 661 |
| V8CompileDuration | 14 |
| TaskDuration | 1996 |
| TaskOtherDuration | 914 |
| ThreadTime | 1 |
| ProcessTime | 2 |
| JSHeapUsedSize | 4568604 |
| JSHeapTotalSize | 6320128 |
| FirstMeaningfulPaint | 1393 |
| Name | Display Time | X | Y | Width | Height |
|---|---|---|---|---|---|
| LargestImage (dumond01.png) | 2.319 s | 115 | 178 | 1120 | 380 |
| <img data-src="https://sizer.aecdaily.com/0x380/res/marketing_images/1034437/dumond01.png" alt="High-Performance Paint Removers: Safe and Effective Alternatives" title="High-Performance Paint Removers: Safe and Effective Alternatives" class="owl-lazy" src="https://sizer.aecdaily.com/0x380/res/marketing_images/1034437/dumond01.png" style="opacity: 1;"> | |||||
How the page is built.
| Summary | |
|---|---|
| HTTP version | HTTP/1.1 |
| Total requests | 78 |
| Total domains | 9 |
| Total transfer size | 5.4 MB |
| Total content size | 6.8 MB |
| Responses missing compression | 29 |
| Number of cookies | 3 |
| Third party cookies | 0 |
| Requests per response code | |
|---|---|
| 200 | 77 |
| 204 | 1 |
| Content | Header Size | Transfer Size | Content Size | Requests |
|---|---|---|---|---|
| html | 1.3 KB | 13.2 KB | 88.4 KB | 4 |
| css | 7.6 KB | 132.0 KB | 638.4 KB | 18 |
| javascript | 9.3 KB | 488.9 KB | 1.3 MB | 24 |
| image | 7.2 KB | 3.5 MB | 3.5 MB | 23 |
| font | 0 b | 24.5 KB | 23.0 KB | 2 |
| other | 1.2 KB | 1.3 MB | 1.3 MB | 4 |
| json | 418 B | 1015 B | 876 B | 1 |
| plain | 370 B | 452 B | 452 B | 1 |
| favicon | 412 B | 14.7 KB | 14.7 KB | 1 |
| Total | 27.9 KB | 5.4 MB | 6.8 MB | 78 |
| Domain | Header Size | Transfer Size | Content Size | Requests |
|---|---|---|---|---|
| www.aecdaily.com | 12.9 KB | 102.6 KB | 349.9 KB | 28 |
| static.aecdaily.com | 5.6 KB | 1.5 MB | 2.1 MB | 15 |
| fonts.bunny.net | N/A | 25.8 KB | 29.2 KB | 3 |
| infodata.aecdaily.com | 1.3 KB | 1.1 KB | 2.1 KB | 4 |
| www.google.com | N/A | 1.5 KB | 1.6 KB | 1 |
| simages.aecdaily.com | 1.4 KB | 639.1 KB | 638.8 KB | 4 |
| matomo.aecdaily.com | 528 B | 21.5 KB | 65.9 KB | 2 |
| www.gstatic.com | N/A | 345.1 KB | 805.9 KB | 1 |
| sizer.aecdaily.com | 6.2 KB | 2.9 MB | 2.9 MB | 20 |
| type | min | median | max |
|---|---|---|---|
| Expires | 0 seconds | 1 day | 1 year |
| Last modified | 18 minutes | 2 years | 13 years |
| Content | Transfer Size | Requests |
|---|---|---|
| html | 0 b | 0 |
| css | 0 b | 0 |
| javascript | 0 b | 0 |
| image | 1.1 MB | 3 |
| font | 0 b | 0 |
| json | 1015 B | 1 |
| plain | 452 B | 1 |
| favicon | 14.7 KB | 1 |
| Total | 1.1 MB | 6 |
Includes requests done after onLoad.
| Content | Transfer Size | Requests |
|---|---|---|
| html | 90 B | 2 |
| css | 0 b | 0 |
| javascript | 0 b | 0 |
| image | 3.2 MB | 15 |
| font | 0 b | 0 |
| other | 527.5 KB | 2 |
| json | 1015 B | 1 |
| plain | 452 B | 1 |
| favicon | 14.7 KB | 1 |
| Total | 3.8 MB | 22 |
Render blocking information directly from Chrome.
| Blocking | In body parser blocking | Potentially blocking |
|---|---|---|
| 31 | 5 | 2 |
Download the Chrome trace log and drag and drop it into Developer Tools / Performance in Chrome.
Collected using the Long Task API. A long task is a task that take 50 milliseconds or more.
| Type | Quantity | Total duration (ms) |
|---|---|---|
| Total Blocking Time | 273 | |
| Max Potential First Input Delay | 167 | |
| Long Tasks before First Paint | 3 | 280 |
| Long Tasks before First Contentful Paint | 3 | 280 |
| Long Tasks after Load Event End | 1 | 63 |
| Total Long Tasks | 10 | 903 |
| name | startTime | duration | containerId | containerName | containerSrc | containerType |
|---|---|---|---|---|---|---|
| self | 567 | 123 | window | |||
| self | 823 | 53 | window | |||
| unknown | 891 | 104 | window | |||
| self | 1063 | 69 | window | |||
| unknown | 1133 | 75 | window | |||
| self | 1313 | 103 | window | |||
| self | 1485 | 77 | window | |||
| unknown | 1646 | 69 | window | |||
| self | 1717 | 167 | window | |||
| self | 9523 | 63 | window |
Calculated using Tracium.
| Categories (ms) | |
|---|---|
| parseHTML | 206 |
| styleLayout | 331 |
| paintCompositeRender | 285 |
| scriptParseCompile | 15 |
| scriptEvaluation | 625 |
| garbageCollection | 91 |
| other | 468 |
| Events (ms) | |
|---|---|
| V8.Execute | 492 |
| RunTask | 426 |
| Layout | 220 |
| CompositeLayers | 173 |
| ParseHTML | 162 |
| UpdateLayoutTree | 112 |
| UpdateLayerTree | 67 |
| ParseAuthorStyleSheet | 44 |
| V8.RunMicrotasks | 41 |
| Paint | 36 |
| V8.GC_HEAP_EMBEDDER_TRACING_EPILOGUE | 32 |
| V8.BytecodeBudgetInterrupt | 31 |
| V8.BytecodeBudgetInterruptWithStackCheck | 30 |
| V8.GC_MC_INCREMENTAL | 26 |
| V8.GC_MARK_COMPACTOR | 21 |
| V8.GC_SCAVENGER_SCAVENGE_ROOTS | 14 |
| V8.ScriptCompiler | 13 |
| EvaluateScript | 12 |
| Tool/domain | Time (ms) |
|---|---|
| static.aecdaily.com | 448.7 |
| Google CDN | 204.4 |
| matomo.aecdaily.com | 70.6 |
| www.aecdaily.com | 18.6 |
Third party requests categorised by Third party web.
| Category | Requests |
|---|---|
| utility | 1 |
| survelliance | 2 |
| cdn | 1 |
| Category | Number of tools |
|---|---|
| utility | 1 |
| survelliance | 2 |
| cdn | 1 |
| utility (1 requests) |
| Other Google APIs/SDKs |
|
| survelliance (2 requests) |
| Other Google APIs/SDKs |
| Google CDN |
|
| cdn (1 requests) |
| Google CDN |
Here's a list of domains that didn't match any tool in Third party web. If you are sure they are third party domains, please do a PR to that project. You can also fine tune the list using --firstParty.
| fonts.bunny.net |
Calculated using .*aecdaily.* (use --firstParty to configure).
| Content | Header Size | Transfer Size | Content Size | Requests |
|---|---|---|---|---|
| html | 1.3 KB | 13.2 KB | 88.4 KB | 4 |
| css | 7.6 KB | 130.7 KB | 632.3 KB | 17 |
| javascript | 9.3 KB | 142.4 KB | 473.5 KB | 22 |
| image | 7.2 KB | 3.5 MB | 3.5 MB | 23 |
| font | 0 b | 0 b | 0 b | 0 |
| other | 1.2 KB | 1.3 MB | 1.3 MB | 4 |
| json | 418 B | 1015 B | 876 B | 1 |
| plain | 370 B | 452 B | 452 B | 1 |
| favicon | 412 B | 14.7 KB | 14.7 KB | 1 |
| Total | 27.9 KB | 5.1 MB | 5.9 MB | 73 |
| Content | Header Size | Transfer Size | Content Size | Requests |
|---|---|---|---|---|
| html | 0 b | 0 b | 0 b | 0 |
| css | 0 b | 1.3 KB | 6.2 KB | 1 |
| javascript | 0 b | 346.6 KB | 807.5 KB | 2 |
| image | 0 b | 0 b | 0 b | 0 |
| font | 0 b | 24.5 KB | 23.0 KB | 2 |
| Total | N/A | 372.3 KB | 836.6 KB | 5 |
Axe is an accessibility testing engine for websites and other HTML-based user interfaces. Read more about axe-core.
Median number of violations for all the runs. Check each individual run to see all the violations.
| Type | Violations (median) |
|---|---|
| Critical | 1 |
| Serious | 2 |
| Moderate | 3 |
| Minor | 1 |
| Per domain | Dirtiest assets | Per Content Type |
We know that using the internet means using electricity, and because most of that electricity comes from fossil fuels, it means that more data we send, the more fossil fuels we end up burning.
This is terrible news for the climate, and building a sustainable web is the 9th of the W3C's Ethical Web Principles.
If you build for the web, much of what you know about making sites faster and more accessible also makes them greener. If you're interested in learning more, you can find out at The Green Web Foundation.
Use--sustainable.pageViewsto configure the number of page views and calculate total CO2 emission.
| Page views | Estimated CO2 emissions (median) | Transfer Size |
|---|---|---|
| 1 page view total | 16.31 grams | 5.4 MB |
| 1 page view first party | 15.41 grams (94.49 %) | 5.1 MB |
| 1 page view third party | 0.90 grams (5.51 %) | 372.3 KB |
| Domain | Estimated CO2 emissions | Transfer Size |
|---|---|---|
| sizer.aecdaily.com | 8.70 grams (53.32 %) | 2.9 MB |
| static.aecdaily.com | 4.44 grams (27.23 %) | 1.5 MB |
| simages.aecdaily.com | 1.90 grams (11.66 %) | 639.1 KB |
| www.gstatic.com green | 0.82 grams (5.02 %) | 345.1 KB |
| www.aecdaily.com | 0.31 grams (1.87 %) | 102.6 KB |
| fonts.bunny.net | 0.08 grams (0.47 %) | 25.8 KB |
| matomo.aecdaily.com | 0.06 grams (0.39 %) | 21.5 KB |
| www.google.com green | 0.00 grams (0.02 %) | 1.5 KB |
| infodata.aecdaily.com | 0.00 grams (0.02 %) | 1.1 KB |
| Asset | Estimated CO2 emissions | Transfer Size |
|---|---|---|
| https://sizer.aecdai...25/fabral01_3.png | 3.09 grams (18.97 %) | 1.0 MB |
| https://simages.aecd...1595b2716c0bc.jpg | 1.89 grams (11.56 %) | 633.6 KB |
| https://sizer.aecdai...4437/dumond01.png | 1.51 grams (9.27 %) | 508.3 KB |
| https://sizer.aecdai...562/hydaway01.png | 1.38 grams (8.45 %) | 463.4 KB |
| https://static.aecda...duotone-900.woff2 | 1.31 grams (8.04 %) | 440.5 KB |
| https://static.aecda...regular-400.woff2 | 1.22 grams (7.51 %) | 411.4 KB |
| https://sizer.aecdai...5_wilsonart14.png | 1.08 grams (6.60 %) | 361.7 KB |
| https://www.gstatic..../recaptcha__en.js | 1.03 grams (6.30 %) | 345.1 KB |
| https://static.aecda...a-solid-900.woff2 | 1.02 grams (6.25 %) | 342.3 KB |
| https://static.aecda...-brands-400.woff2 | 0.35 grams (2.12 %) | 116.1 KB |
| Content Type | Estimated CO2 emissions | Transfer Size |
|---|---|---|
| image | 10.61 grams (65.06 %) | 3.5 MB |
| other | 3.90 grams (23.91 %) | 1.3 MB |
| javascript | 1.46 grams (8.92 %) | 488.9 KB |
| css | 0.39 grams (2.41 %) | 132.0 KB |
| font | 0.07 grams (0.45 %) | 24.5 KB |
| favicon | 0.04 grams (0.27 %) | 14.7 KB |
| html | 0.04 grams (0.24 %) | 13.2 KB |
| json | 0.00 grams (0.02 %) | 1015 B |
| plain | 0.00 grams (0.01 %) | 452 B |


